dnSpy is a portable debugger and .NET assembly editor for use when editing and debugging assemblies even if the source code isn't available.

Download
dnSpy is a portable debugger and .NET assembly editor for use when editing and debugging assemblies even if the source code isn't available.
dnSpy is intended to assist in decompiling various assemblies allowing you to understand their functionality better. It is geared towards software developers that may need to reverse engineer .NET assemblies and handle obfuscated code by putting the required tools in one convenient location.
dnSpy Features:
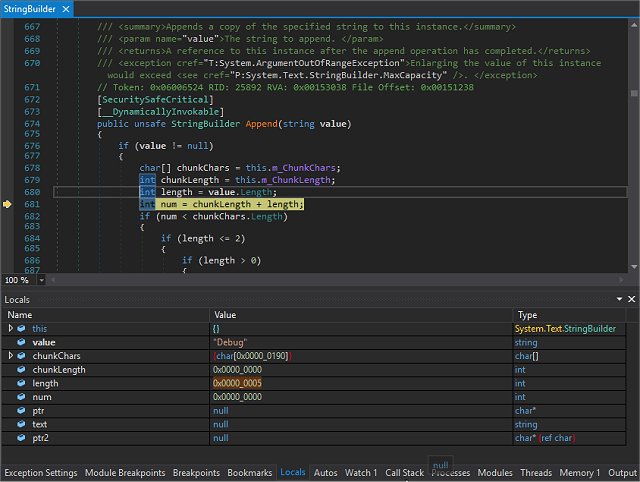
-Debug .NET Framework, .NET Core and Unity game assemblies, no source code required
-Set breakpoints and step into any assembly
-Locals, watch, autos windows
-Variables windows support saving variables (eg. decrypted byte arrays) to disk or view them in the hex editor (memory window)
-Object IDs
-Multiple processes can be debugged at the same time
-Break on module load
-Tracepoints and conditional breakpoints
-Export/import breakpoints and tracepoints
-Call stack, threads, modules, processes windows
-Break on thrown exceptions (1st chance)
-Variables windows support evaluating C# / Visual Basic expressions
-Dynamic modules can be debugged (but not dynamic methods due to CLR limitations)
-Output window logs various debugging events, and it shows timestamps by default
-Assemblies that decrypt themselves at runtime can be debugged, dnSpy will use the in-memory image. You can also force dnSpy to always use in-memory images instead of disk files.
-Public API, you can write an extension or use the C# Interactive window to control the debugger
Assembly Editor
-All metadata can be edited
-Edit methods and classes in C# or Visual Basic with IntelliSense, no source code required
-Add new methods, classes or members in C# or Visual Basic
-IL editor for low-level IL method body editing
-Low-level metadata tables can be edited. This uses the hex editor internally.
Hex Editor
-Click on an address in the decompiled code to go to its IL code in the hex editor
-Reverse of above, press F12 in an IL body in the hex editor to go to the decompiled code or other high-level representation of the bits. It's great to find out which statement a patch modified.
-Highlights .NET metadata structures and PE structures
-Tooltips show more info about the selected .NET metadata / PE field
-Go to position, file, RVA
-Go to .NET metadata token, method body, #Blob / #Strings / #US heap offset or #GUID heap index
-Follow references (Ctrl+F12)
Other
BAML decompiler
Blue, light and dark themes (and a dark high contrast theme)
Bookmarks
C# Interactive window can be used to script dnSpy
Search assemblies for classes, methods, strings etc
Analyze class and method usage, find callers etc
Multiple tabs and tab groups
References are highlighted, use Tab / Shift+Tab to move to the next reference
Go to the entry point and module initializer commands
Go to metadata token or metadata row commands
Code tooltips (C# and Visual Basic)
Export to project

Download

